Tile Narrative: Scrollytelling with Grid Maps
Republished on Data Visualization Society’s Nightingale
While choropleth maps are the go-to method to visualize geographic data, they tend to skew attention towards the bigger states (blocks). Some data stories need equal emphasis for each block (state) and be arranged in a way that is close to the actual map representation. That is where tile grid maps shine. As Danny DeBelius points out, they can be the perfect way to avoid the visual imbalances typical to traditional choropleths.
Tile grid maps
Tile Narrative
Lately, I’ve been creating stories in scrollytelling format which, simply put, is a technique wherein the content or graphic on the webpage changes as the user scrolls up or down. This form of storytelling technique is quite popular in data-driven journalism, among others. I wanted to explore how this format can be used with tile grid maps, specifically enabling textual narratives closer to the visual elements (small multiple charts).
That led me into merging tile grid maps and scrollytelling together to explain the visual with automated narrative insights. With an utter lack of imagination on my part, I’m calling this format Tile Narrative.
Tile Narrative = Tile grid maps + Narratives + Scrollytelling
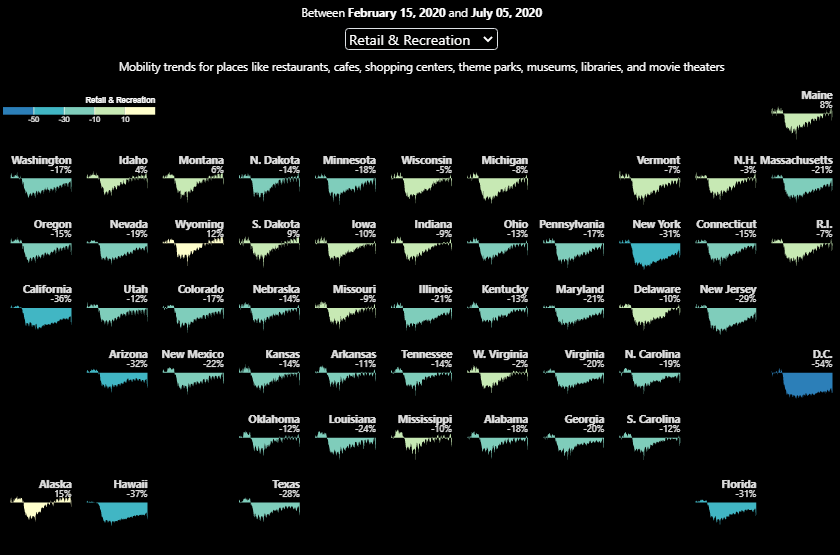
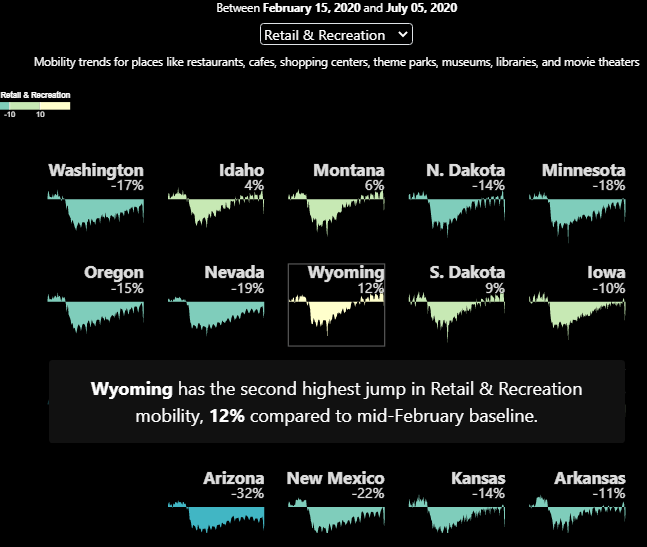
I’ve employed these three powerful storytelling techniques to weave an effective interactive format for geographic data gleaned from Google mobility. We wanted to understand how states across the US have limited their movements to different places since COVID-19 outbreak. As of writing this article, the story highlights nine states have a higher retail & recreation mobility today compared to mid-February baseline, among other insights. (Note: insights change with updates to underlying mobility data)
Click for Interactive
Tile narratives call for the right use of interactions that engage the readers to spend more time with insights and details that would be shadowed otherwise.
Interactive setup
With insights and tile of interest dynamically in sync while scrolling, it becomes easier to hold the reader’s attention. This is how you can use the tile narrative to set up a story:
- Draw a small multiple tile grid map.
- Construct narratives from the data.
- Link each narrative insight to a tile via state identifier.
- Trigger an event (state of interest) as you scroll to an insight.
- Zoom the map into the tile of interest.
That’s it. This simple technique allows you to engage the reader with a small multiple and insights in context.
Tile Narrative
Insights for this Google’s community mobility dataset can be structured by answering questions such as:
- How many regions are better off now compared to the past?
- What are #1, #2 regions with highest gain in mobility?
- What are #1, #2 regions with highest drop in mobility?
- How do states (e.g. California and New York) compare with their neighbors? etc.
These insights can be auto-generated as data changes. Although, I’ve automated the textual insights with data-driven rules for the mobility story, you can hand-craft these insights and decide the flow for the story as it merits.
The two primary components that needs to be built are charts and scroll events. I’ve used d3.js for charts and scrollama for scrollytelling. You can also implement the same with other libraries. Read Russell Goldenberg’s blog on how to implement scrollytelling with six different libraries.
Try the Interactive here and share your feedback.